

A specialized design tool for turning data into infographics and reports, prioritizing structured layouts over the freeform creative flexibility of general design platforms.
Excellent for internal communications and data-heavy reports, weaker for high-volume social media asset production.
Analysis based on product data, pricing structure, traffic signals, and public user sentiment.
Who Should Use Piktochart?
Typical users
HR managers, internal communications leads, and educators who need to present complex data clearly without formal design training.
Maturity fit
beginner to scaling
Choose this if…
- Your primary goal is creating long-form infographics or data-heavy reports
- You want a structured, block-based editor that prevents layout breaking
- You need to import data directly from Excel or Google Sheets into charts
- Your priority is professional, corporate-style visuals over trendy social media graphics
Skip this if…
- You need a mobile app for designing on the go
- You require advanced photo manipulation or vector illustration tools
- You need a massive library of trendy social media video templates
- Your workflow relies on a generous free tier for frequent downloads
About Piktochart
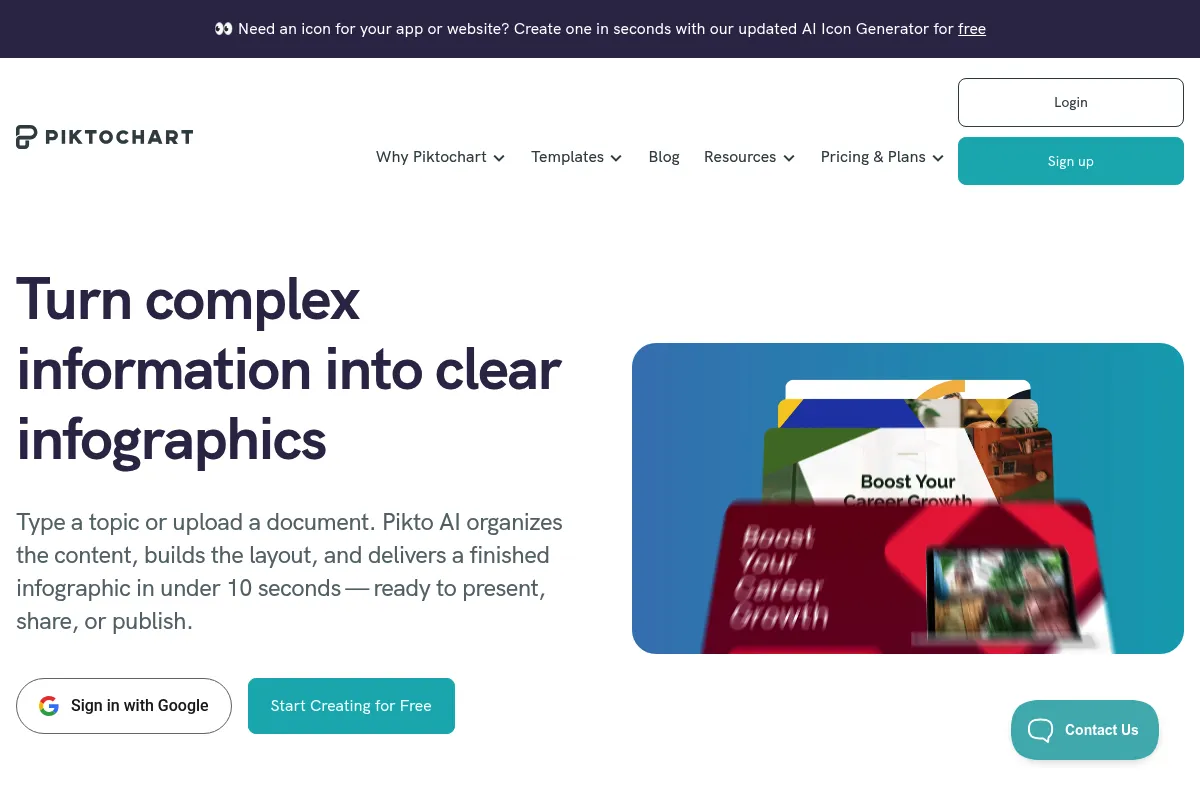
Piktochart is a web-based visual communication platform focused on infographics, reports, and presentations. It exists to help non-designers in corporate and educational environments simplify complex information into digestible visual formats.
What it actually does
It provides a structured editor for building multi-page reports and vertical infographics using pre-built content blocks. Users can generate interactive charts and maps by importing external data or using built-in design components.
What makes it different
Unlike the 'everything for everyone' approach of Canva, Piktochart focuses on 'information design.' Its block-based editor is specifically built for long-form vertical content, making it easier to reorder sections without manually resizing the entire canvas.
Ratings across the web

Ratings aggregated from independent review platforms.
Key Features
Chart Component
Connects to external data sources to auto-populate 15+ different chart types.
Block-based Editor
Allows users to reorder or duplicate sections of an infographic without disturbing the rest of the layout.
Map Maker
Creates interactive regional or global maps based on user-provided data points.
Brand Assets
Stores logos, color palettes, and custom fonts to ensure all team outputs remain on-brand.
Piktochart Video
A separate tool for transcribing long-form video and cutting it into captioned social media clips.
Design Components
Pre-styled lists, timelines, and comparisons that snap into place.
Password Protection
Secures shared links for sensitive internal reports or client data.
Pricing
Free
- 5 active visuals
- 2 downloads total
- 100MB storage
- Piktochart watermark
Pro
- Unlimited visuals
- Unlimited downloads
- 100GB storage
- Brand Kit
- HD exports
Business
- SSO login
- Personalized onboarding
- Security review
- Custom contracts
Pricing checked 6 months ago
Pricing guidance
- When you need to remove the Piktochart watermark
- When you exceed the 2-download lifetime limit
- When you need to upload custom brand fonts and logos
- Free plan storage is capped at 100MB
- The 'Free' plan downloads are limited to 2 for the life of the account, not per month
- Education and Non-profit discounts require manual verification
Mid-range pricing that is affordable for individuals but becomes expensive for large teams compared to all-in-one suites.
Pros & Cons
Strengths
-
Superior data visualization
Handles complex charts and maps with more precision than generic design tools, allowing for actual data imports rather than just manual entry.
-
Structured layout management
The block system prevents the 'messy canvas' problem, making it much faster to build long, vertical infographics that stay aligned.
-
Professional template library
Templates lean toward corporate utility and educational clarity, reducing the time spent filtering through 'loud' social media designs.
Weaknesses
-
Extremely restrictive free tier
The limit of 2 downloads total (not per month) makes the free version a trial rather than a usable long-term tool.
Affects: Casual users and students
-
No mobile application
Design work is strictly tethered to the desktop browser, which is a significant gap compared to competitors like Canva or Adobe Express.
Affects: Social media managers and on-the-go professionals
-
Editor performance lag
The interface can become sluggish when handling large infographics with high-resolution images or numerous data points.
Affects: Power users creating long-form reports
Real User Sentiment
Users generally view Piktochart as a reliable, 'no-nonsense' tool for professional reporting, though many find the pricing model for small teams frustrating.
Users tend to like
- Ease of creating professional charts
- The block-based editing system
- High-quality PDF exports
- Clean, corporate-ready templates
Users commonly complain about
- The 2-download limit on the free plan
- Lack of a mobile app
- Occasional slow loading times in the editor
- Price increases over the last few years
Recurring tradeoffs
- You trade creative freedom for layout structure; it's harder to make 'art' but easier to make a readable report.
Happiest users
Internal communications professionals who need to turn boring spreadsheets into readable executive summaries.
Often frustrated
Casual creators who expect a functional free version for occasional social media posts.
Use Cases
HR Onboarding
Creating visual handbooks and policy summaries for new hires.
Marketing Reports
Converting monthly KPI spreadsheets into digestible PDF summaries for stakeholders.
Classroom Projects
Students creating data-driven posters for science or history assignments.
Non-profit Impact Reports
Visualizing donation usage and program outcomes for annual reviews.
Internal Training
Building step-by-step process infographics for technical teams.
Frequently Asked Questions
Is Piktochart better than Canva?
It depends on the use case. Canva is superior for social media, video, and general creative tasks. Piktochart is better for data-heavy infographics and structured reports due to its block-based editor and more robust charting tools.
Does the free version have a watermark?
Yes, all visuals created on the free plan include a Piktochart watermark at the bottom. You must upgrade to the Pro plan ($14/mo billed annually) to remove it.
Can I use Piktochart offline?
No, Piktochart is a cloud-based web application. You need an active internet connection to create, edit, and export your designs.
Can I import my own data?
Yes, you can import data from Excel files (.xlsx or .csv) or link directly to a Google Sheet to keep your charts updated automatically.
What are the download limits?
The free plan only allows 2 downloads for the entire lifetime of the account. The Pro and Business plans offer unlimited downloads in formats like PNG, PDF, and PPTX.
Does Piktochart offer an education discount?
Yes, Piktochart has specific pricing for students and teachers, typically around $39.99 per year, which is significantly lower than the standard Pro plan.
Why trust this page?
This evaluation combines product positioning, pricing analysis, traffic and market signals, and public user sentiment into a single decision-support page. Content is generated editorially — not copied from the vendor's website.
Funding & Company
Founded
2011
Stage
Acquired
Total Raised
$240K
Latest Round
Seed (Jan 2015)
Notable Investors
Piktochart operated on a primarily bootstrapped model for over a decade, taking in only a small government grant and a seed round early in its history. In March 2026, the company was acquired by ThriveCart, providing a stable financial backing and a strategic home for the product.
Market Signals & Traffic
Estimated visits, global rank, geography, traffic sources, monthly visit trends, and organic search keywords (Similarweb)—on a dedicated page built for depth and search.
- Estimated visits
- 0
- Global rank
- —
- Snapshot
- May 2026
- Traffic trend
- Falling
Estimated monthly visits
Alternatives to Piktochart
View all alternativesCanva AI
Content Creation

Online design tool for creating graphics, presentations, videos, and websites.
Visme
Content Creation, Design, Productivity

All-in-one platform for creating presentations, infographics, and visual content.
Similar Tools
Modyfi
Design, Content Creation, Video Creation

Collaborative design platform for image editing, vector graphics, and animation.
Canva
Design, Content Creation, Video Creation

Visual communication platform for creating professional designs, videos, and documents.
Placeit
Design, Content Creation, Video Creation

Design platform for creating mockups, logos, and social media graphics.
ImagineArt
Design, Content Creation, Video Creation

Create and edit high-quality digital art and videos from text.
Pica AI
Design, Content Creation, Video Creation
Face swapping and image generation tool for creative visual content.
Leyline
Gaming, Content Creation, Workflow
Creative production and asset management platform for gaming studios.