

A specialized product analytics suite that prioritizes deep behavioral mapping over simple traffic metrics—essential for product-led growth but overkill for basic marketing sites.
Excellent for tracking complex user journeys and retention, weaker for teams without engineering resources to manage event instrumentation.
Analysis based on product data, pricing structure, traffic signals, and public user sentiment.
Who Should Use Amplitude?
Typical users
Product managers, growth engineers, and data analysts at SaaS, fintech, or mobile app companies.
Maturity fit
scaling to advanced
Choose this if…
- Your priority is understanding user retention over simple acquisition
- You need to build complex behavioral cohorts for targeted analysis
- You want to identify which specific features correlate with long-term customer value
Skip this if…
- You only need basic web traffic stats like page views and bounce rates
- You lack the developer bandwidth to implement custom event tracking
- Your budget cannot accommodate steep price increases as event volume scales
About Amplitude
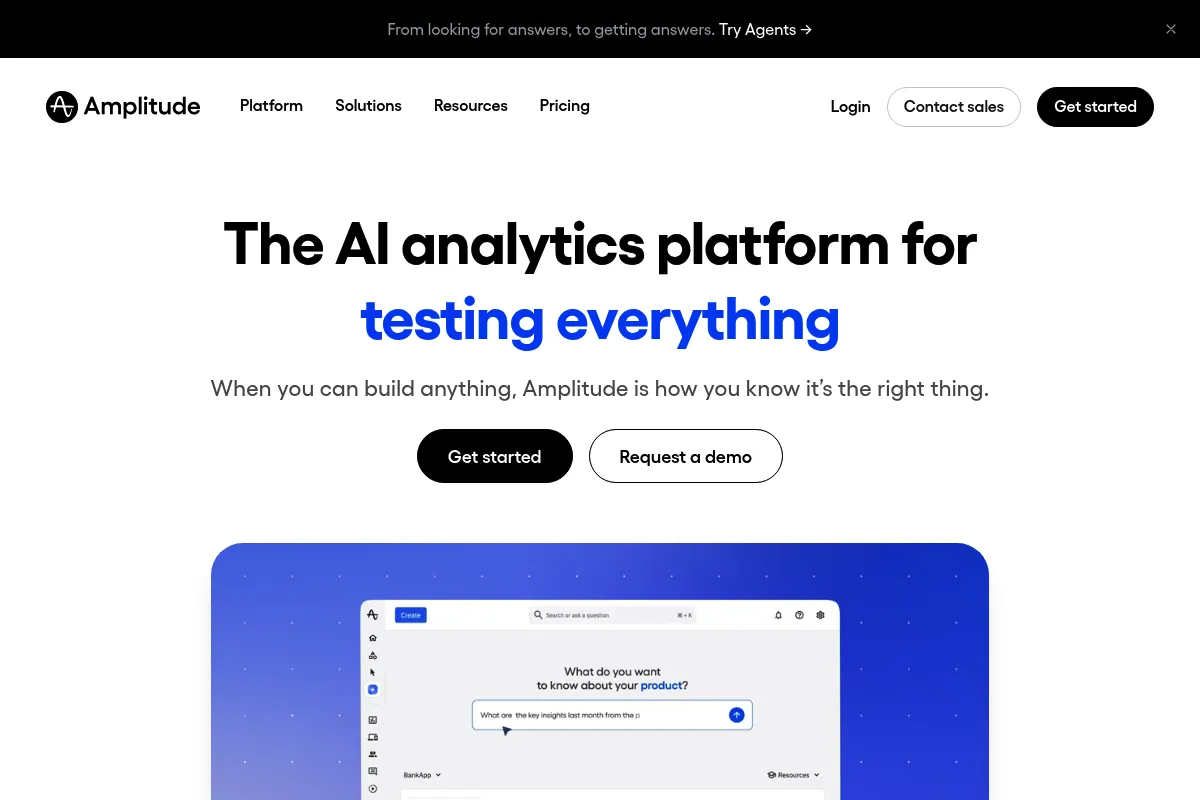
Amplitude is a behavioral analytics platform built to help product teams understand how users interact with their software. It focuses on event-based data rather than session-based tracking, allowing for granular analysis of the user lifecycle from onboarding to churn.
Official profiles
What it actually does
It captures specific user actions—like clicking a button or completing a profile—and organizes them into visual reports. Teams use these reports to build conversion funnels, measure feature adoption, and perform longitudinal retention studies.
What makes it different
Unlike general-purpose analytics, Amplitude's architecture is built for 'behavioral sequences.' Its proprietary Nova architecture allows for near-instant queries on massive datasets without needing pre-aggregation, making it faster than SQL-based tools for complex cohort analysis.
Ratings across the web

Ratings aggregated from independent review platforms.
Key Features
Compass
Identifies the specific user actions that most strongly predict long-term retention.
Pathfinder
Shows all the different sequences of actions users take after a specific starting point.
Behavioral Cohorts
Groups users based on actions they performed, such as 'users who used the search feature 3+ times.'
Notebooks
Collaborative documents that combine live data charts with text explanations for team sharing.
Root Cause Analysis
Automatically surfaces the underlying factors contributing to changes in a metric.
Session Replay
Links visual recordings of user behavior directly to the event data in a report.
Data Taxonomist
Tools to clean, merge, and manage event names to prevent data clutter.
Pricing
Starter
- 10 million events per month
- Core analytics charts
- Unlimited data seats
- Basic data governance
Plus
- Starts at 1 million events
- Behavioral cohorts
- Custom properties
- Email and Slack support
Growth
- Advanced behavioral analytics
- SSO and advanced permissions
- Data monitoring and alerts
- A/B testing (add-on)
Enterprise
- Full suite including CDP
- Premium support and training
- Advanced data governance
- Custom data retention
Pricing checked 6 months ago
Pricing guidance
- Exceeding the 10M event limit on Starter
- Needing to sync cohorts to marketing tools like Braze
- Requiring SSO for security compliance
- Needing the 'Experiment' module for A/B testing
- Data retention is limited on lower tiers
- Session Replay and Experiment are usually separate paid add-ons
- The Plus plan actually has a lower event limit (1M) than the Starter plan (10M) to force a choice between volume and features
Premium positioning that becomes an enterprise-level investment as a company scales.
Pros & Cons
Strengths
-
Superior retention analysis
The platform's ability to break down retention by cohort and behavior is more sophisticated than Mixpanel or GA4.
-
Generous free tier
The 10 million monthly events included in the Starter plan allow early-stage startups to use professional-grade tools for a long time.
-
High query speed
Even with millions of data points, reports like funnels and cohorts load in seconds, enabling rapid exploration.
-
Integrated experimentation
Having A/B testing built into the analytics suite means you can target experiments based on existing behavioral data without extra integration.
Weaknesses
-
High implementation effort
You cannot just 'drop a script' and get value; it requires a detailed tracking plan and significant developer time to instrument events.
Affects: Small teams without dedicated engineering support
-
Complex pricing at scale
As your user base grows, event-based pricing can become prohibitively expensive and difficult to predict.
Affects: High-growth B2C apps with high event volume
-
Steep learning curve
The interface is dense and technical; non-data-literate users often find it difficult to build accurate reports without training.
Affects: Marketing and non-technical business users
Real User Sentiment
Users generally view Amplitude as the most powerful tool in its class, though they frequently complain about the complexity of its UI and the opacity of its enterprise pricing.
Users tend to like
- The depth of the cohort analysis
- Speed of generating complex funnel reports
- The 'Notebooks' feature for sharing insights
- Reliability of data compared to GA4
Users commonly complain about
- UI can be overwhelming for beginners
- High cost of add-on features
- Difficulty in setting up and maintaining a clean tracking plan
- Aggressive sales tactics for enterprise upgrades
Recurring tradeoffs
- You trade ease of setup for depth of insight. It takes weeks to set up correctly, but provides answers other tools can't.
Happiest users
Data-driven product managers who need to justify roadmap decisions with hard behavioral evidence.
Often frustrated
Marketers who just want to see where their website traffic is coming from and find the interface too 'product-heavy'.
Use Cases
SaaS Retention Analysis
Identifying which feature usage leads to higher subscription renewal rates.
Onboarding Optimization
Mapping the 'Aha!' moment for new users to shorten the time-to-value.
Conversion Funnel Debugging
Finding the exact step in a multi-page checkout where mobile users drop off.
Feature Impact Measurement
Comparing the behavior of users who adopted a new feature versus those who didn't.
Churn Prediction
Building cohorts of 'at-risk' users based on declining activity levels to trigger win-back campaigns.
Frequently Asked Questions
How does Amplitude compare to Google Analytics 4?
GA4 is primarily for marketing attribution and acquisition (where users come from). Amplitude is for product behavior (what users do once they are inside). While GA4 has moved toward an event-based model, Amplitude's cohorting and retention tools are significantly more advanced for product development.
Is Amplitude free?
Yes, there is a Starter plan that is free for up to 10 million events per month. This is one of the most generous free tiers in the industry, though it lacks advanced features like behavioral cohorts and SSO.
What is an 'event' in Amplitude pricing?
An event is any action a user takes that you choose to track, such as 'Clicked Sign Up' or 'Viewed Page.' Amplitude's pricing is primarily based on the total volume of these events sent to their servers each month.
Do I need a developer to set up Amplitude?
Yes. Unlike basic web analytics, Amplitude requires custom code (SDKs or API calls) to be integrated into your application to track specific user actions. It is not a 'no-code' solution for deep product insights.
Can Amplitude track mobile apps and websites together?
Yes, Amplitude is cross-platform. It can unify user data from iOS, Android, and Web into a single user profile, allowing you to see the complete journey as a user moves between devices.
Does Amplitude offer session replays?
Yes, Amplitude recently added Session Replay. It allows you to watch a video-like reconstruction of a user's session, which is integrated directly into your analytics charts so you can see the 'why' behind the data.
Why trust this page?
This evaluation combines product positioning, pricing analysis, traffic and market signals, and public user sentiment into a single decision-support page. Content is generated editorially — not copied from the vendor's website.
Funding & Company
Founded
2012
Stage
Public
Total Raised
$336.9M
Latest Round
Grant (Jan 2023)
Notable Investors
Amplitude has raised a total of $315.9 million over nine funding rounds, culminating in a public offering in September 2021. This substantial funding from top-tier investors like Sequoia Capital, GIC, and Benchmark indicates strong market confidence and provides the company with significant resources for product development and long-term stability.
Market Signals & Traffic
Estimated visits, global rank, geography, traffic sources, monthly visit trends, and organic search keywords (Similarweb)—on a dedicated page built for depth and search.
- Estimated visits
- 1,525,114
- Global rank
- #21,632
- Snapshot
- Apr 2026
- Traffic trend
- Surging
Estimated monthly visits
Alternatives to Amplitude
View all alternatives
Similar Tools
Mendix
Developer Tools, Automation & Agents, Workflow

Low-code platform for building and deploying enterprise applications.
Auctor
Marketing Automation, Automation & Agents, Sales

Automated lead generation and personalized outreach for sales teams
Operator
AI Assistant, Automation & Agents, Communication

Autonomous agents for customer service and support workflows.
Arthur
Developer Tools, Privacy & Compliance

Observability and governance platform for machine learning models.
Liquid AI
Developer Tools, Research

High-performance foundation models for long-context data and edge computing
Panopto
Education, Training & Onboarding, Communication

Video management platform for education and enterprise training.