

PydanticAI
A Python-centric observability platform that integrates directly with Pydantic models to provide structured tracing and logging without the configuration overhead of traditional APM tools.
Excellent for Python teams using FastAPI or Pydantic who need deep visibility into data validation, but weaker for polyglot environments requiring a single observability vendor.
Analysis based on product data, pricing structure, traffic signals, and public user sentiment.
Who Should Use PydanticAI?
Typical users
Python developers, backend engineers using FastAPI, and data engineers who rely on Pydantic for data integrity.
Maturity fit
scaling to advanced
Choose this if…
- Your stack is primarily Python and heavily utilizes Pydantic models
- You find OpenTelemetry configuration too complex for your current needs
- You want to see exact validation errors and data payloads within your traces
- Your priority is developer experience and quick setup over infrastructure monitoring
Skip this if…
- You operate a polyglot microservices architecture (Go, Rust, Node.js) and need a unified dashboard
- You require deep infrastructure-level monitoring (CPU/RAM/Disk) alongside application traces
- Your organization is already standardized on a mature APM like Datadog or New Relic
About PydanticAI
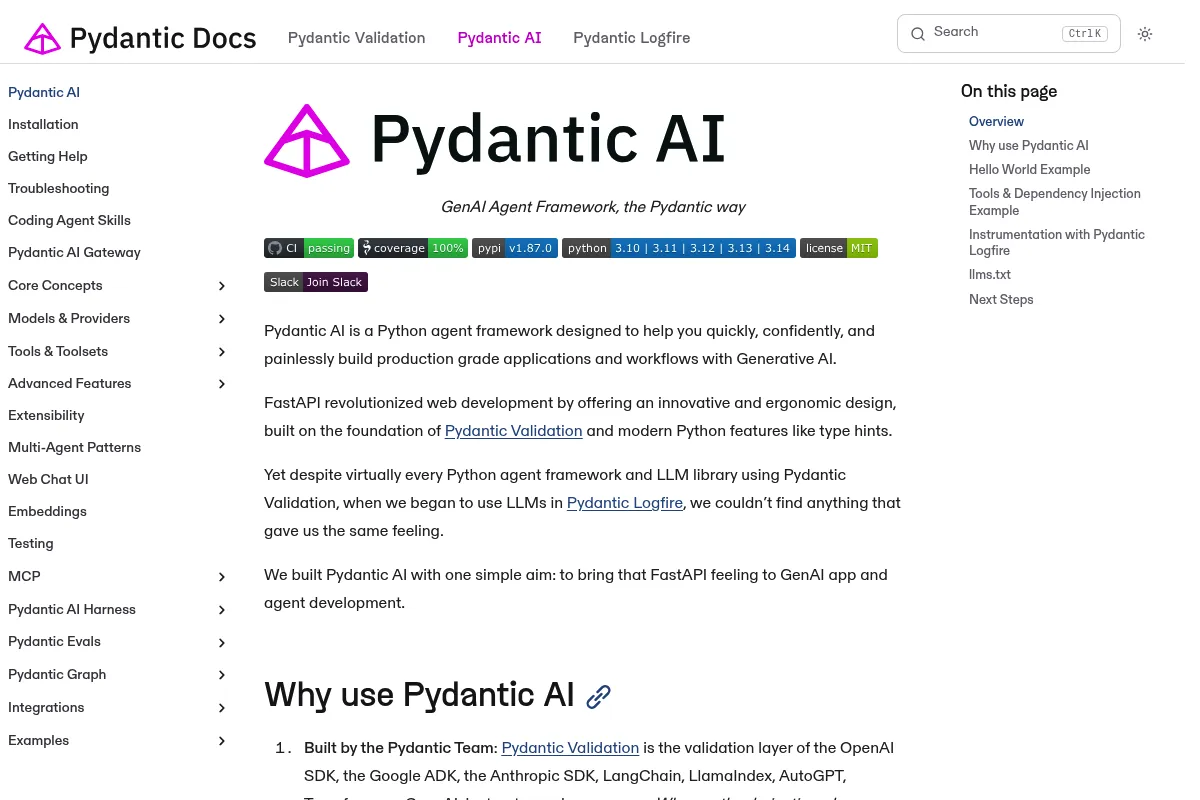
Pydantic Logfire is an observability platform built by the team behind the Pydantic library. It provides structured logging, tracing, and profiling specifically optimized for the Python ecosystem, using OpenTelemetry as its underlying standard.
Official profiles
What it actually does
It captures application traces and logs, automatically instrumenting popular Python frameworks like FastAPI, HTTPX, and SQLAlchemy. It specifically highlights Pydantic validation errors, showing exactly which field failed and why within the context of a request trace.
What makes it different
Unlike generic observability tools, Logfire is 'Pydantic-native.' It understands the structure of your data models, allowing it to display validation failures and data transformations as first-class citizens in the UI rather than just strings in a log file.
Key Features
Pydantic Integration
Shows validation errors and model data directly in the trace timeline.
Auto-Instrumentation
Captures database queries and HTTP requests without manual code changes.
Structured Tracing
Groups related logs into spans to visualize the execution flow of a request.
OpenTelemetry Native
Uses standard protocols, preventing total vendor lock-in for data collection.
Dashboarding
Provides pre-built views for common metrics like latency, error rates, and throughput.
SQL Profiling
Breaks down query execution time to identify slow database interactions.
Python-First SDK
Designed to feel idiomatic to Python developers, avoiding the 'Java-style' boilerplate of other SDKs.
Pricing
Free
- 1 million spans per month
- 30-day data retention
- Unlimited team members
- Community support
Pro
- 2 million spans included
- $0.02 per 1k spans thereafter
- 90-day data retention
- Priority support
- Advanced alerting
Enterprise
- Custom span volume
- Extended retention periods
- SSO and SAML
- Dedicated account manager
Pricing checked 5 months ago
Pricing guidance
- When you need more than 30 days of data history for compliance or trend analysis
- When your monthly span volume exceeds 1 million
- When you need advanced alerting logic beyond basic thresholds
- Data retention is strictly capped by plan tier
- The $24/user fee applies to all organization members, not just active users of the dashboard
Mid-market pricing that is more affordable than Datadog for high-volume tracing but more expensive than self-hosted solutions.
Pros & Cons
Strengths
-
Zero-config data visibility
If you use Pydantic, Logfire automatically understands your data structures, making it significantly faster to debug validation logic than using standard logging.
-
Clean, developer-focused UI
The interface avoids the 'cockpit' complexity of Datadog, focusing on the specific information a backend developer needs to fix a bug.
-
OpenTelemetry foundation
Because it's built on OTel, you can export your data to other platforms later if your needs outgrow Logfire's specific feature set.
Weaknesses
-
Python-centric limitations
While it supports OTel, the unique value proposition (Pydantic integration) is irrelevant for services written in other languages.
Affects: Polyglot engineering teams
-
Immature ecosystem
As a newer tool, it lacks the deep library of third-party integrations and advanced infrastructure monitoring found in legacy APM suites.
Affects: DevOps and SRE teams
-
Seat-based pricing friction
Charging per organization member can become expensive for large teams where only a few people need deep tracing access.
Affects: Large engineering departments
Real User Sentiment
Users are generally enthusiastic about the ease of setup and the clarity of the trace UI compared to industry giants.
Users tend to like
- The 'it just works' experience with FastAPI
- Visualizing Pydantic validation errors in the trace
- The lack of complex OTel boilerplate code
- The speed of the web interface
Users commonly complain about
- Pricing can scale quickly with high-traffic applications
- Lack of infrastructure monitoring (RAM/CPU)
- Limited documentation for complex custom OTel setups
Recurring tradeoffs
- You trade broad infrastructure visibility for deep application-level Python insights.
Happiest users
FastAPI developers building data-intensive applications who are frustrated with standard text logs.
Often frustrated
SREs looking for a single tool to monitor Kubernetes clusters, databases, and multi-language services.
Use Cases
Debugging FastAPI Validation
Quickly identifying which field in a complex JSON payload caused a 422 Unprocessable Entity error.
Performance Bottleneck Hunting
Using the SQL profiler to find N+1 query problems in SQLAlchemy or SQLModel.
Production Error Tracking
Replacing generic error logs with full traces that show the state of variables at the time of failure.
Data Pipeline Monitoring
Tracking the flow of data through multiple Pydantic transformations in a processing script.
Local Development
Running Logfire locally to inspect application behavior during the coding phase rather than waiting for staging.
Frequently Asked Questions
Is there a free version of Pydantic Logfire?
Yes, there is a free tier that includes 1 million spans per month and 30 days of data retention. This is usually enough for small projects or early-stage development.
How does Logfire compare to Datadog?
Logfire is significantly easier to set up for Python apps and offers deeper Pydantic-specific insights. However, Datadog is a much broader platform that includes infrastructure monitoring, log management, and support for dozens of languages, which Logfire currently lacks.
Does it only work with Python?
While Logfire is built on OpenTelemetry and can technically ingest data from any OTel-compliant source, its unique features and SDKs are currently optimized almost exclusively for Python.
What is a 'span' in Logfire pricing?
A span represents a single unit of work, such as an HTTP request, a database query, or a function execution. Logfire's pricing is based on the total number of these units processed each month.
Can I use Logfire with Django?
Yes, Logfire supports Django through its OpenTelemetry-based auto-instrumentation, though the experience is most refined for FastAPI and other Pydantic-heavy frameworks.
Is my data secure with Logfire?
Logfire allows you to scrub sensitive data before it leaves your environment using its SDK. It is designed to be SOC2 compliant, though you should verify their current status on their security page for enterprise requirements.
Why trust this page?
This evaluation combines product positioning, pricing analysis, traffic and market signals, and public user sentiment into a single decision-support page. Content is generated editorially — not copied from the vendor's website.
Funding & Company
Founded
2022
Stage
Series a
Total Raised
$17.2M
Latest Round
Series A (Oct 2024)
Notable Investors
Pydantic has raised a total of $17.2 million over two rounds, including a $4.7M Seed round and a $12.5M Series A. Both rounds were led by top-tier investor Sequoia Capital, signaling strong confidence in the company's strategy to build commercial developer tools on top of its widely adopted open-source library.
Market Signals & Traffic
Estimated visits, global rank, geography, traffic sources, monthly visit trends, and organic search keywords (Similarweb)—on a dedicated page built for depth and search.
- Estimated visits
- 0
- Global rank
- —
- Snapshot
- Apr 2026
- Traffic trend
- —
Estimated monthly visits
Alternatives to PydanticAI
View all alternatives
Similar Tools
Agenta
Developer Tools, Automation & Agents

Open-source platform for building, evaluating, and deploying LLM applications.
Cerebras
Developer Tools, Automation & Agents
High-speed infrastructure for large-scale model inference and training
Cognition
Developer Tools, Automation & Agents

Autonomous software engineer that plans and executes complex coding tasks.
Smol.ai
Developer Tools, Automation & Agents

Autonomous agent that generates entire codebases from simple markdown prompts.
Zep
Developer Tools, Automation & Agents
Long-term memory and data persistence layer for LLM applications.
Sweep
Developer Tools, Automation & Agents

Junior developer assistant that handles bug fixes and feature requests